Background
In July of 2016 Axis Group was approached by a huge soccer league to do a proof of concept for a dashboard for analyzing secondary market sales of their club’s tickets.
Most soccer clubs try to fill their seats in advance by offering standard rates on either individual games or season passes.
Secondary markets such as Ticketmaster and SeatGeek, however, where these tickets are resold, see fluctuations in prices everyday leading up to the game. These fluctuations depend on a number of factors such as which teams are playing, how popular those teams are, how good the view from the seat is, how close to game day it is, etc.
This environment more closely matches a free market where supply and demand drive prices.
The League’s analysis shows that resale activity is a good proxy for understanding relative demand for our games and wants its clubs to leverage that knowledge to adjust their own pricing so they could maximize profits by selling directly to fans. Clubs use this data in a variety of ways, including:
1) understand how the market perceives the value of their tickets (are they reselling above or below face value, and by how much)
2) understand how the market perceives the value of different locations in the stadium relevant to one another (how should the stadium be scaled)
3) understand the value of different games for variable or dynamic pricing purposes;
4) for marketing, when should they put out different offers based on demand for tickets, and how resale pricing compares to the club’s pricing.
This is a complex, multi-factorial analysis and one that would need interactive tools and data visualization to help uncover insights and patterns. The league wanted to evaluate multiple tools including Qlik Sense with extension objects and so they approached Axis Group for a proof-of-concept.
Project Approach
This was a two week project with one week of design followed by another week and a half of development. I worked on designing mockups for the PoC along with one other designer. The development team included a data architect and a senior developer(visual analytics practice lead) whom we consulted inorder to determine feasibility of our ideas both in terms of data availability and ease of build.
Understand(Interview and Document Review)
Since the project was very lean we moved at a very fast pace going from research to design in a matter of 5 days. We started by interviewing the Director of Business Development of the soccer league in order to understand their motivations and key questions they wish to have answered. Both me and the other designer participated in the interview and were able to synthesize what we heard into the following key questions:
- Did specific tickets sell for more than their face value? Where in the stadium?
- Which seats sell out the fastest for a game?
- How does a stadium sell tickets over time?
- Are there specific games in which seats sell out first?
- Do games against a particular opponent sell at a higher price? Do games against a particular opponent sell more tickets on the secondary market?
- How do ticket prices fluctuate as one approaches game day? (the hypothesis is that demand for popular games peaks very close to game day and then collapses the day of)
The call also helped us understand the League’s motivation in pursuing this project — while clubs have data about their own sales they do not have any information about other club’s sales to be able to benchmark their performance. As such the League wanted to be the intermediary through whom clubs would mutually share high level metrics about ticket pricing for benchmarking. For security, it was important that no club be able to drill into another club’s numbers.
Key Requirements:
- Visually appealing presentation of the subset of the data;
- Summary of 4 KPIs (# tickets resold per game, average resale price, % difference of resale price vs. season ticket face value, % difference of resale price vs. single game ticket face value), league ranks for KPIs, and comparison to League and peer group
- Ability for user to drill down to view data at the game level (home games for their club)
Another requirement, that emerged was to incorporate a logo bar chart comparing clubs against each other. (The designers were not too happy about this)
Key Metrics:
- # tickets resold per game
- average resale price
- % difference of resale price vs. season ticket face value
- % difference of resale price vs. single game ticket face value
- league ranks for all KPI’s i.e. how dies it vary team to team
- comparison to league and peer group i.e. how does a team’s metric compare to the league’s average as a whole as well as their peer group
Concept Generation
Since neither I, nor the other designer was a soccer fan we took to some google searching in order to find examples of other sports related visualizations to get our creative juices flowing.
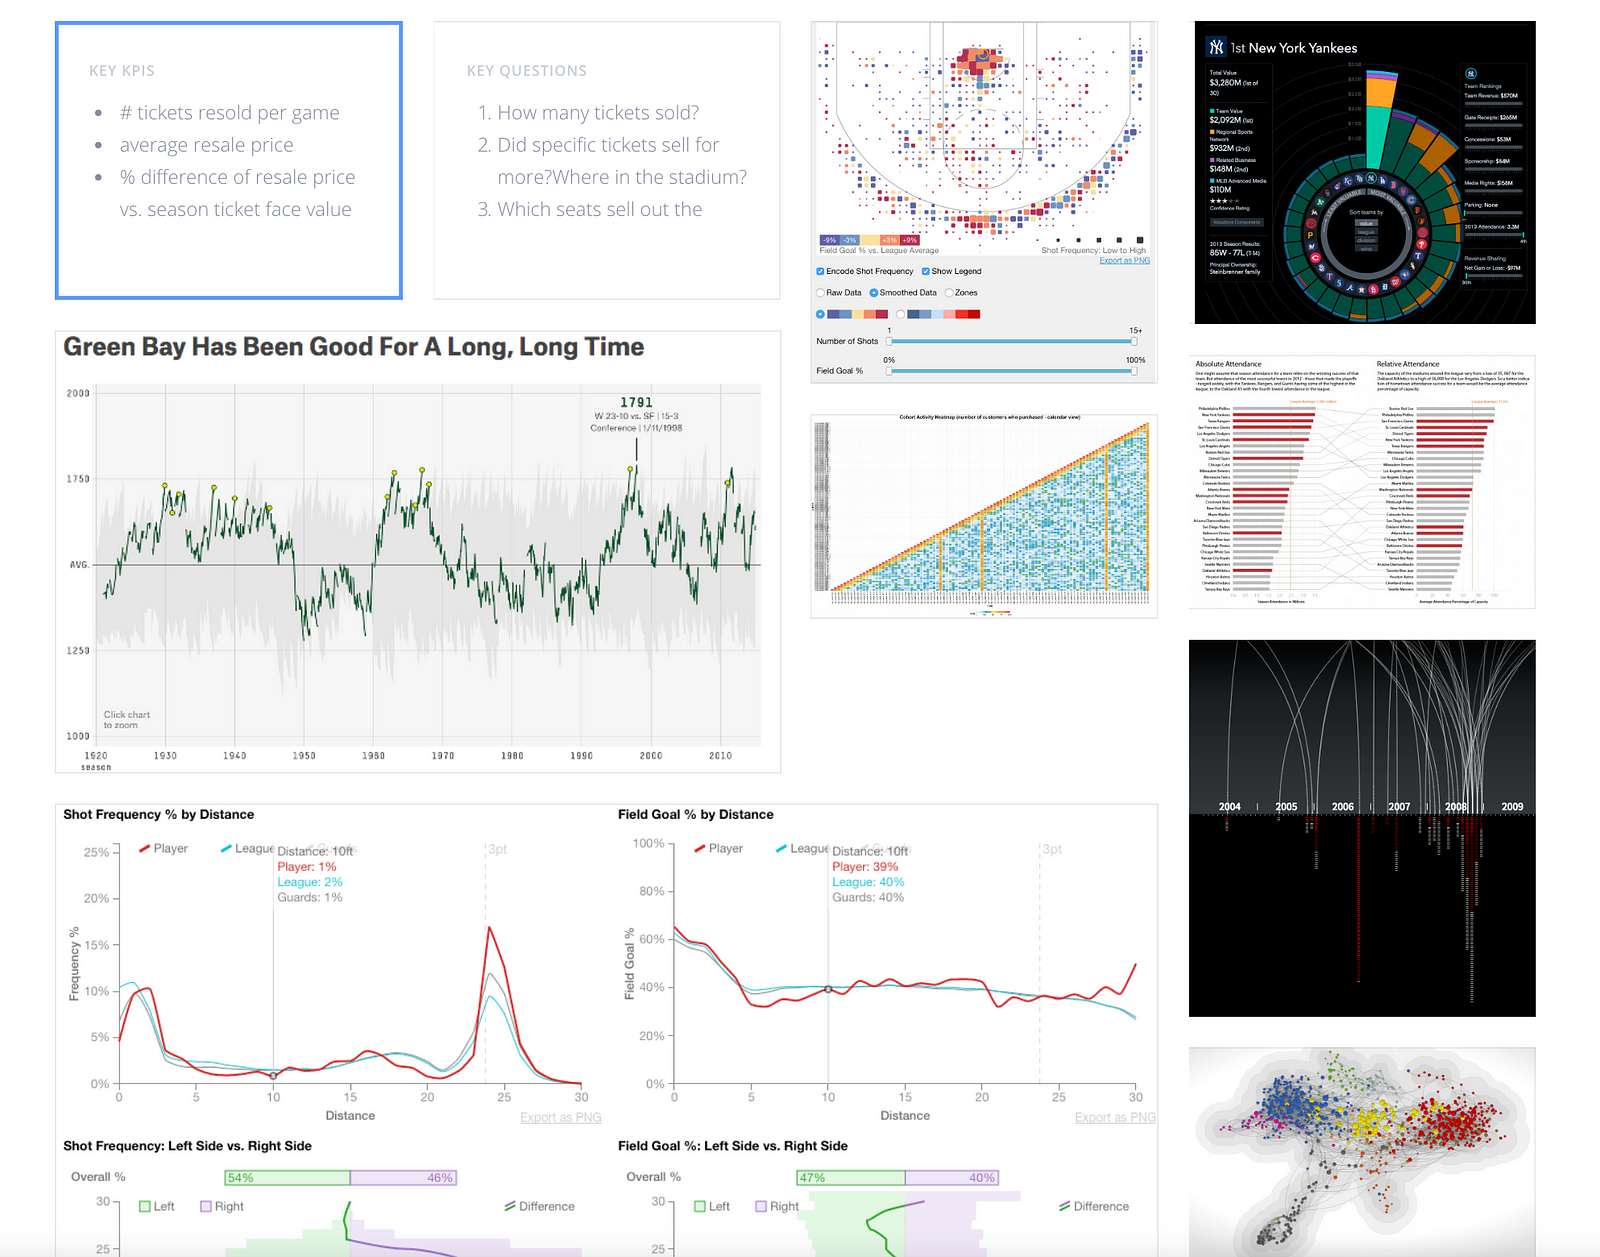
We shared our search results with each other and then took to diverging in order to sketch ideas based on the questions we uncovered.
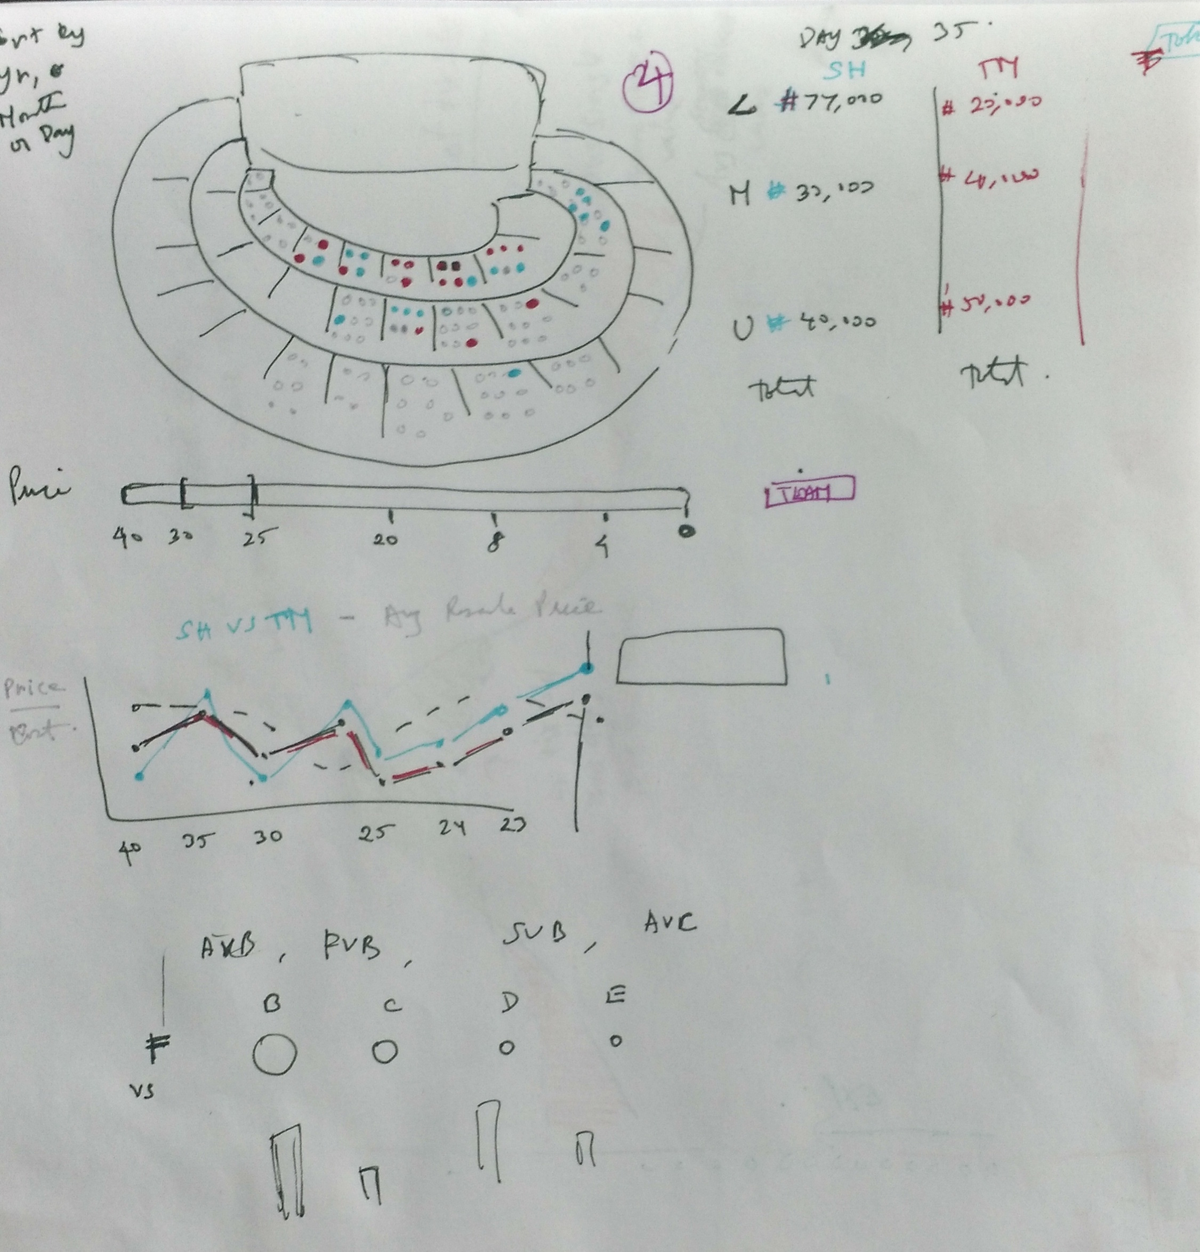
As is often the case with brainstorming we had some similar as well as different ideas. At this stage, we conducted a brainstorming session with the senior developer to see which ideas were both interesting and feasible.
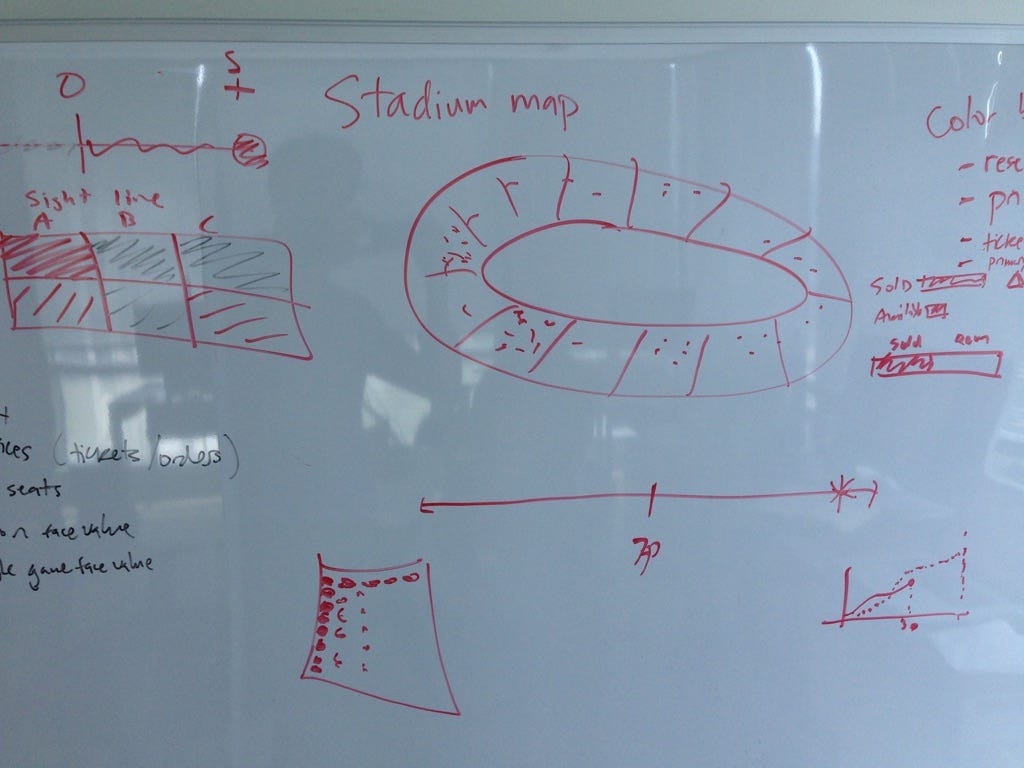
Based on feedback from our white-boarding session we had a better understanding of what was doable and so we picked concepts which told a good story and converted them into mockups.
Mockups(using Sketch)
Summary Page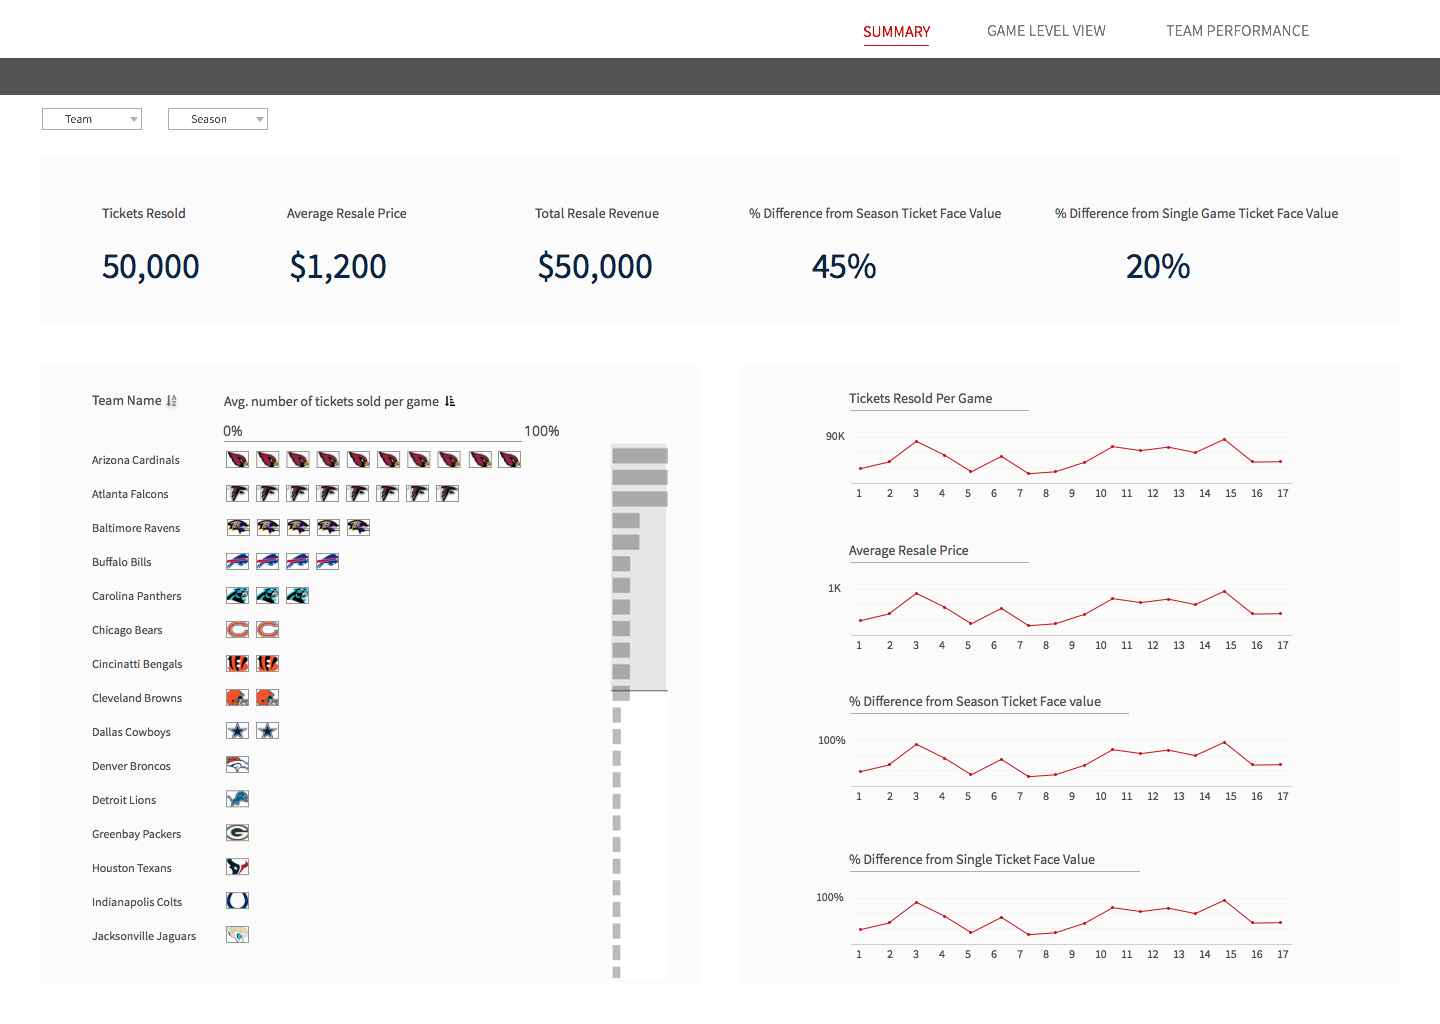
This page fulfills a key requirement listed by the client which is to compare oneself against other clubs in the league based on the KPI’s listed earlier. The logo bar chart can be dynamically updated to show another metric by clicking on the corresponding KPI.
We also included trends for these KPI’s where one can track movement of metrics over the course of games in the season.
This page helps answer questions such as:
· Which cities have the most tickets resold over the course of a year?
· Which games tend to have the highest resale value?
Game Level View
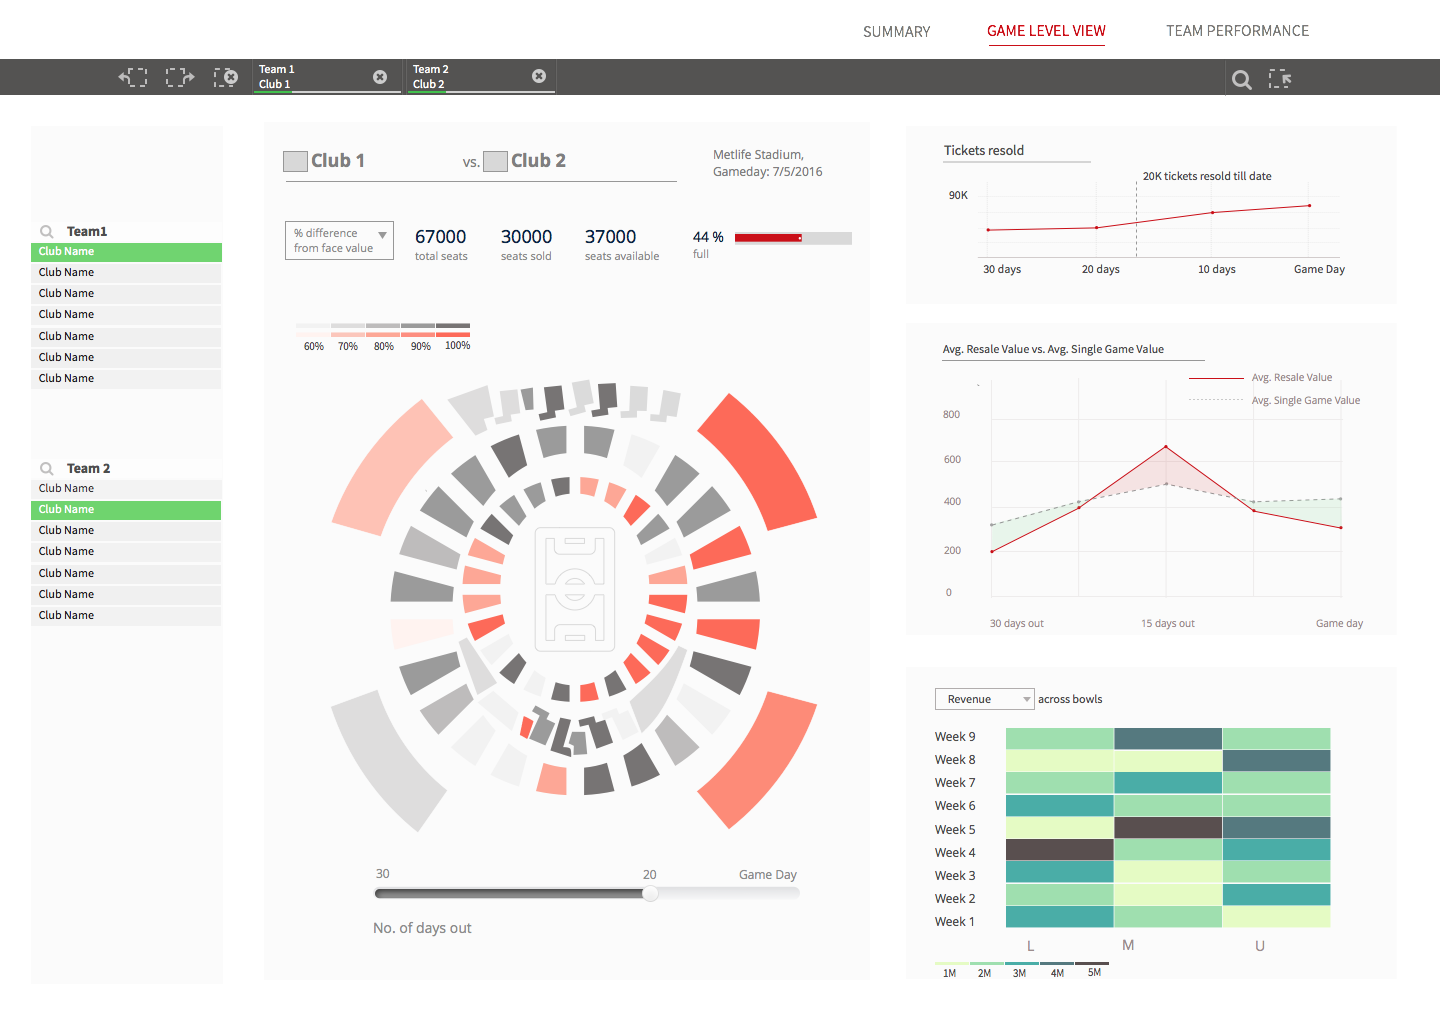
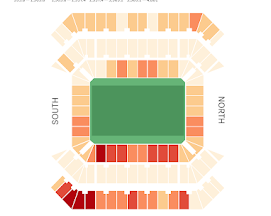
One of the key features of this page is a heat map comparing sections in the stadium against each other based on the desired metric. This map is paired with a time slider and can be used to answer questions such as-
· Where in the stadium are customers obtaining the highest resale values?
· How many days out are the highest resale values achieved, and how many days out do most ticket resales occur?
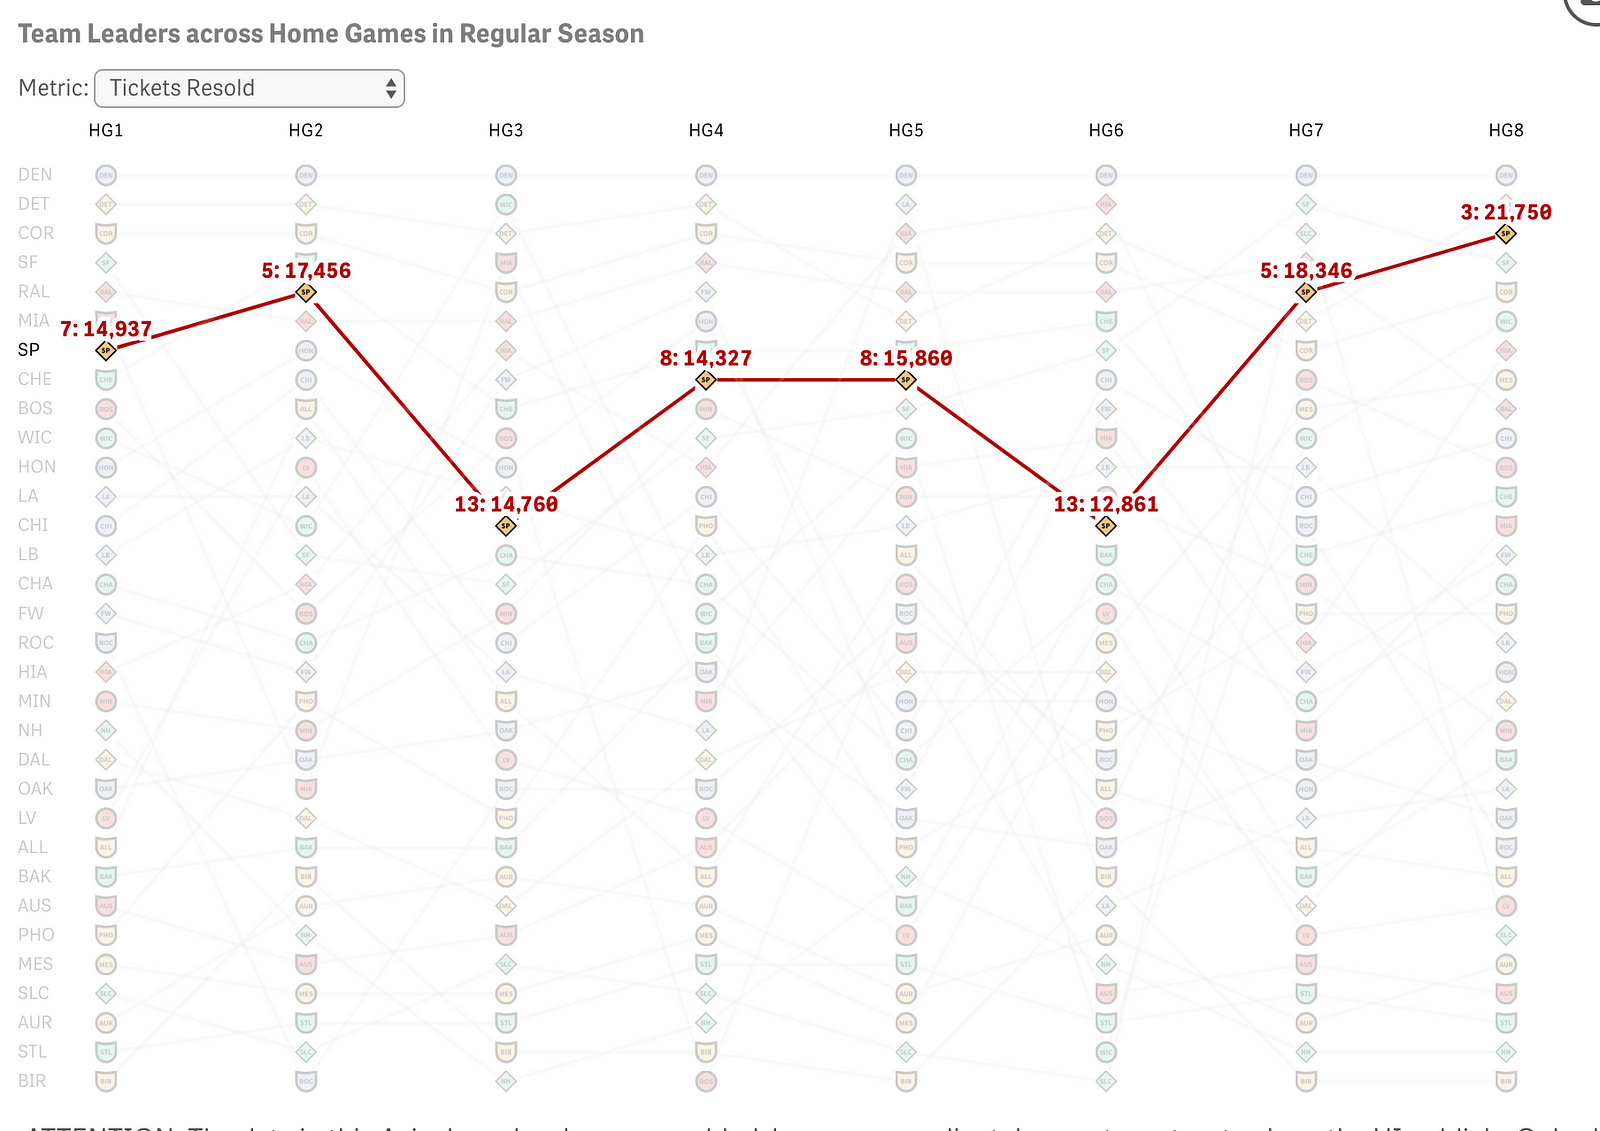
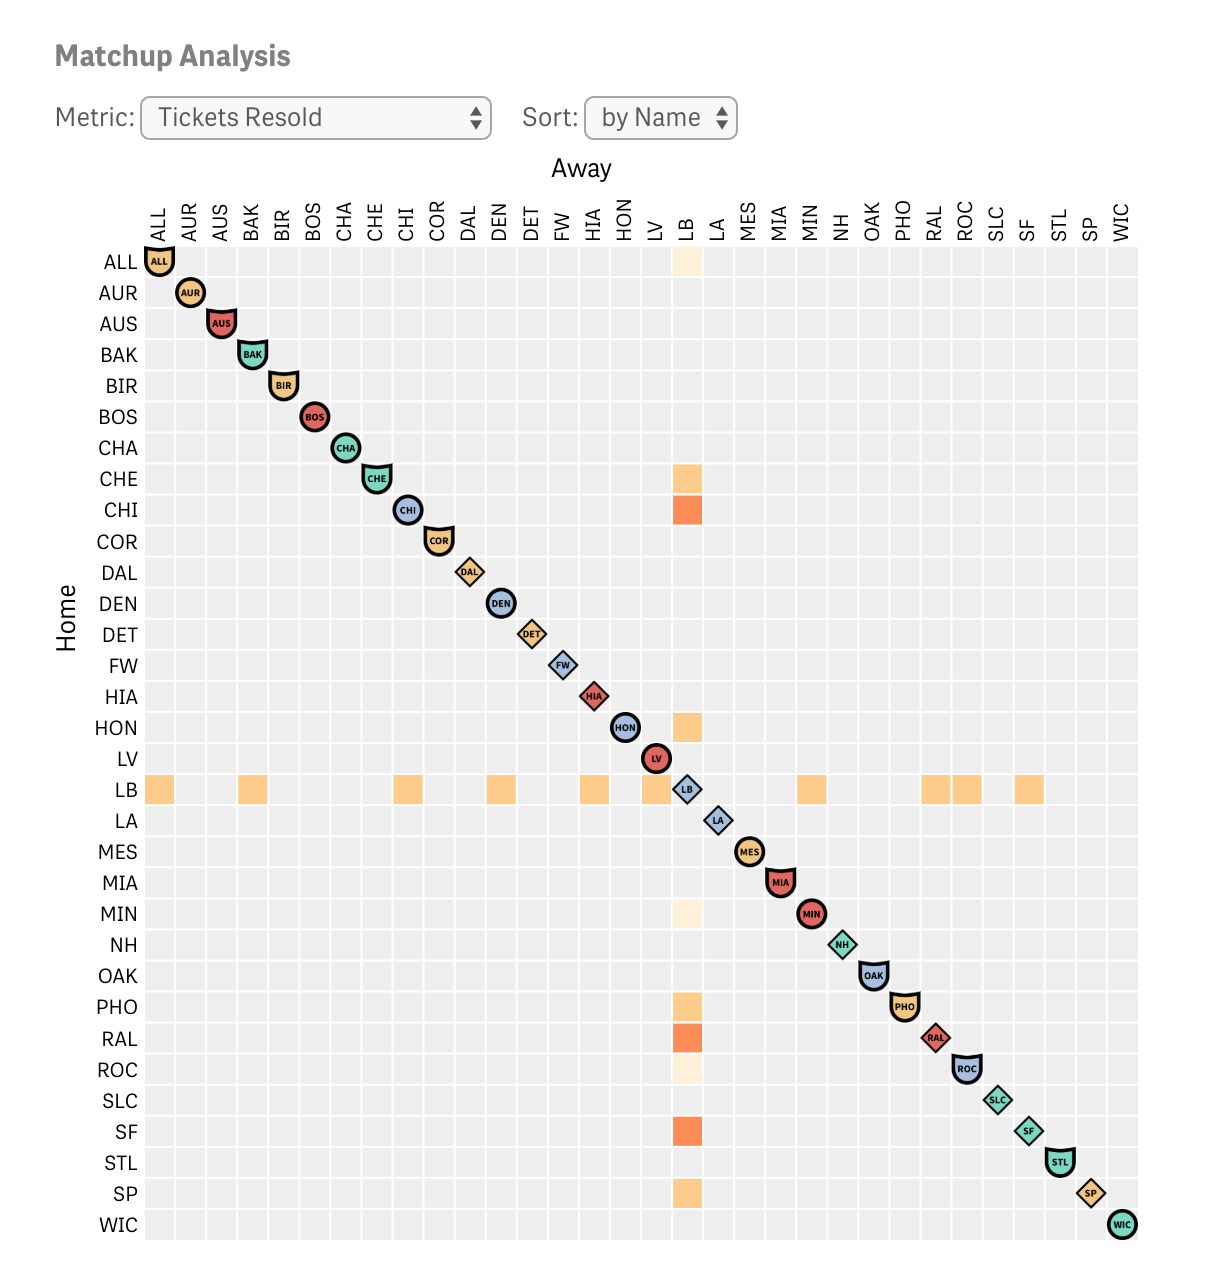
Team Performance
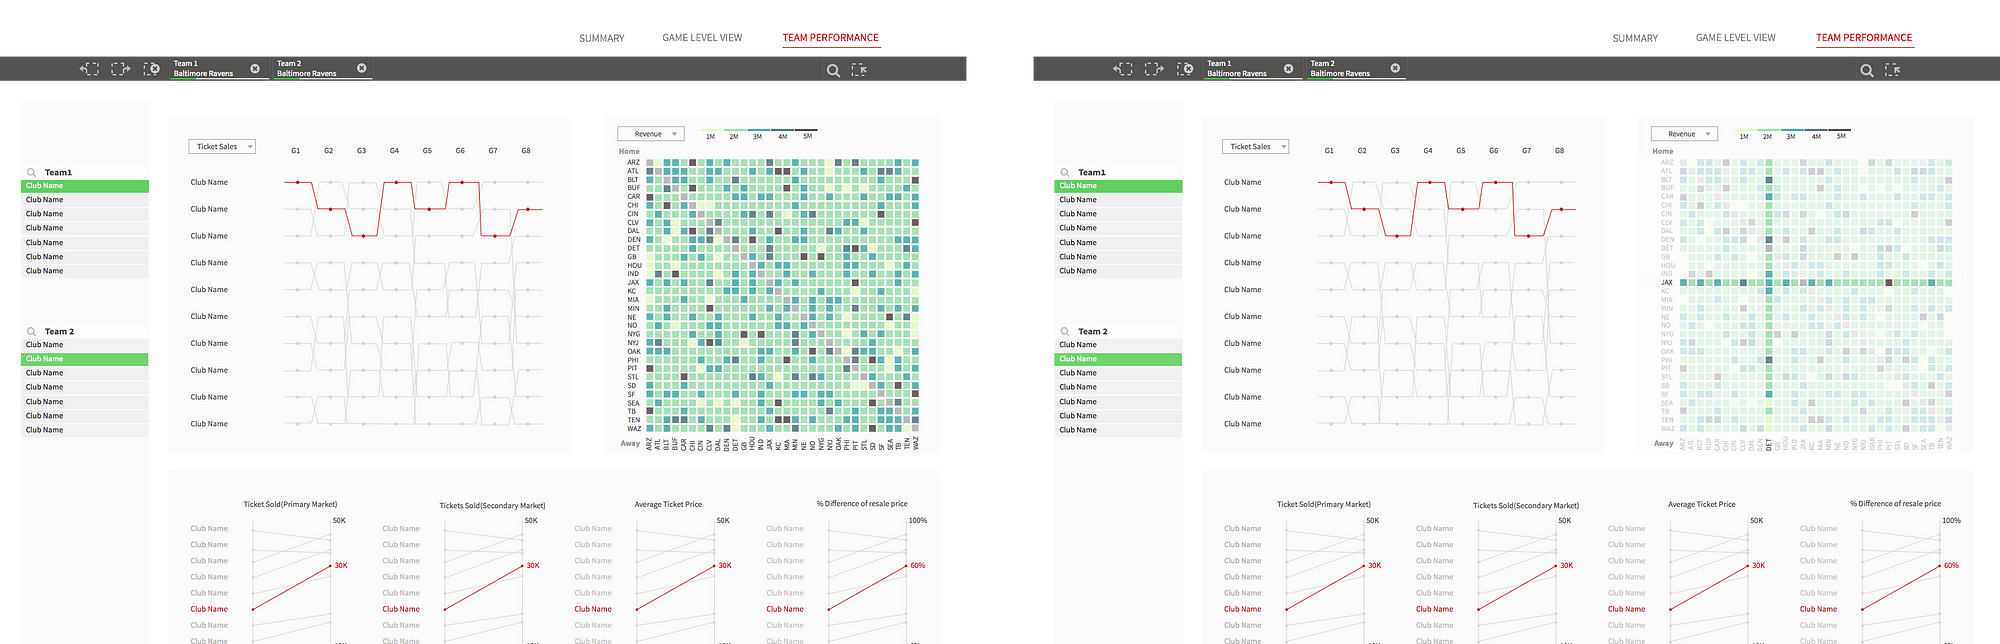
This sheet tracks the performance across several metrics of each team compared to the rest of the league throughout the course of the season. This sheet also analyzes which matchups produced the best resell opportunities
Questions answered:
- · Which matchups had the highest resale value?
- · Which teams had the highest resale value throughout the season?
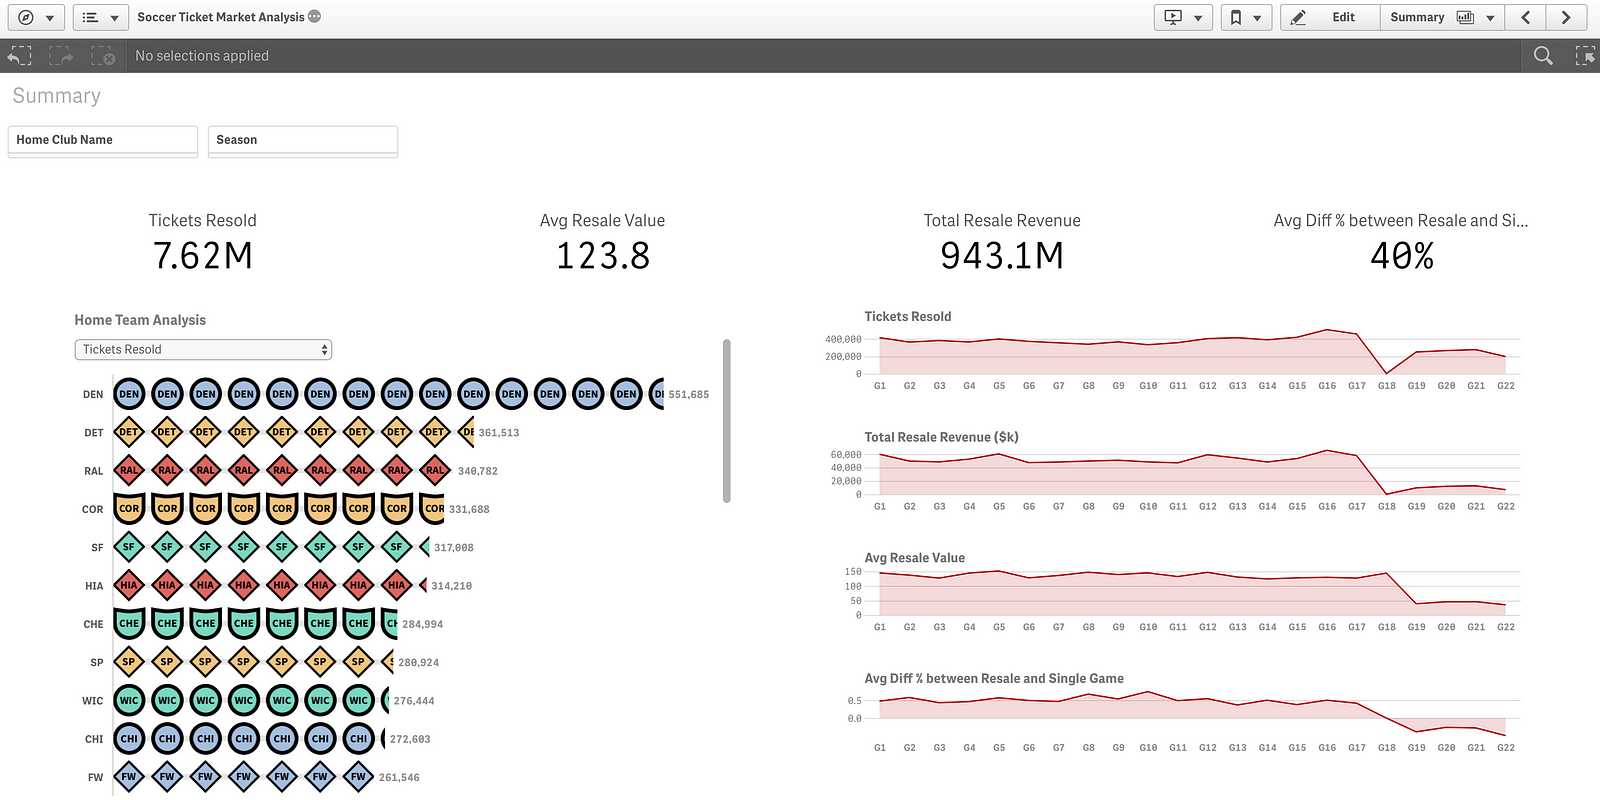
Implementation
We handed off our final designs and worked with them as they built it to ensure the dashboard was built to spec. Below are some screenshots of the app:
Impact
Our was very impressed with the demo that was led by our Senior Developer. They especially appreciated him walking them the process of creation of the proof of concept from design to development.
We ended up winning the contract and doing a larger design effort around the ticketing app.
This was one of my very first projects at Axis (3 weeks into my job) and I am very glad to have been given the opportunity to work on this project. To this day this demo serves as a great marketing tool for using Qlik Sense extensions to get past limitations of out of the box Qlik objects.