Qlik Hack Challenge 2017 Winner
Overview
This project was built in response to the brief below from the ‘Qlik Hack Challenge’.
The Democratic Republic of Congo is slowly recovering from a conflict known as Africa’s first world war, which led to the loss of some five million lives between 1994 and 2003. Many eastern areas are still plagued by violence as various rebel groups continue to operate there.
Our goal was to build a tool for conflict analysis tool for the United Nations for them to be able to understand the problem using the Armed Conflict Location & Event Data Project (ACLED) dataset provided by the UN. This dataset provided information on conflict events that have happened in Africa in the last 20 years.
You can view a demo of our solution here→
Our approach
Our hackathon team comprised of UX Designers, Web Developers and Data Scientists. As a UX Designer I collaborated with the team on research and designing visual concepts to answer key questions posed by the UN.
Key questions for conflict analysis:
- How and when have civilians been affected by these incidents, in different parts of the country and over time?
- Who are the main actors and what is their impact on the conflict?
- Can spikes in the frequency and intensity of incidents be correlated with any other parameters?
- Based on the features and actions of an actor/group, can we predict the likelihood of future behavior?
One of our goals in visualizing this data was not just to present the data but also tell a story while staying true to the reality of the situation and conveying the horrors of the events. As we dug deeper into the data what emerged was a complex story involving several actors such as government forces, political militias, rebels, protestors, etc. Since the reality of the situation was more complex than the common theme of good guy vs. bad guy, we wanted to build exploratory tools that let a user interact and explore the data freely.
Through divergent and convergent ideation around key questions posed by the UN, we came up with the following views:
-
Timeline – Storytelling View
-
Actor Analysis – Exploratory Analysis
-
Outcome Prediction – Predictive view
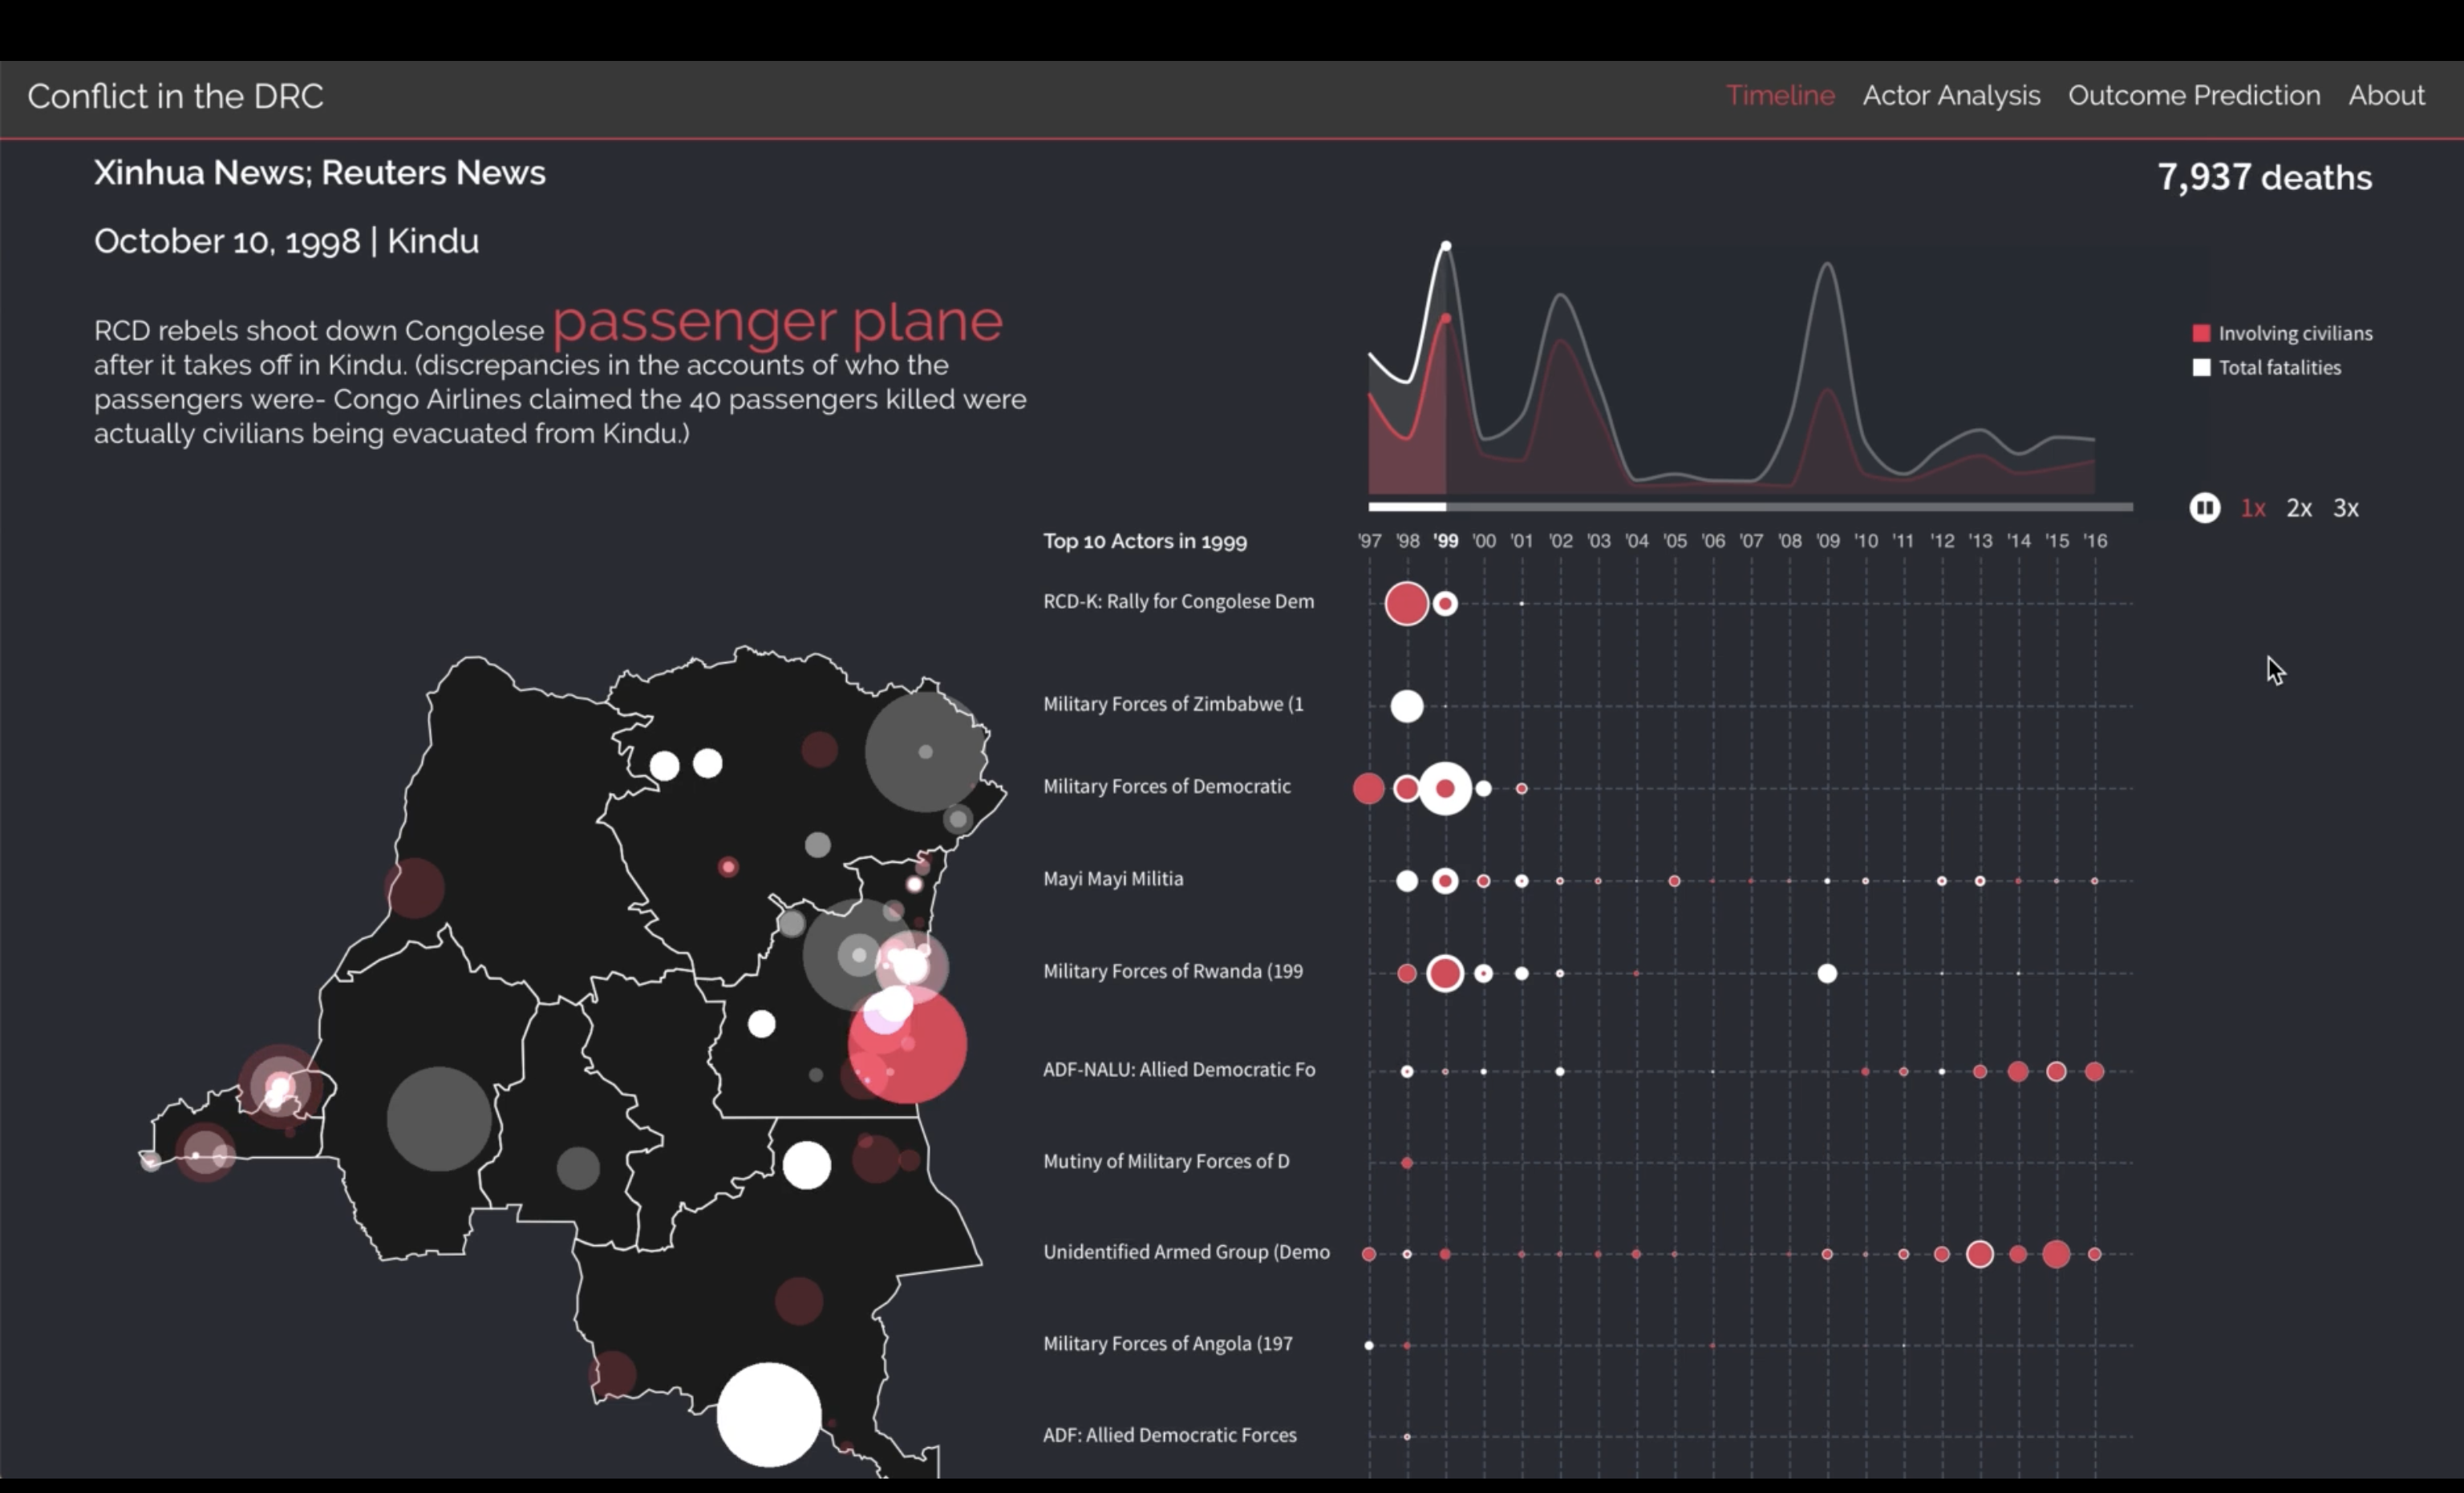
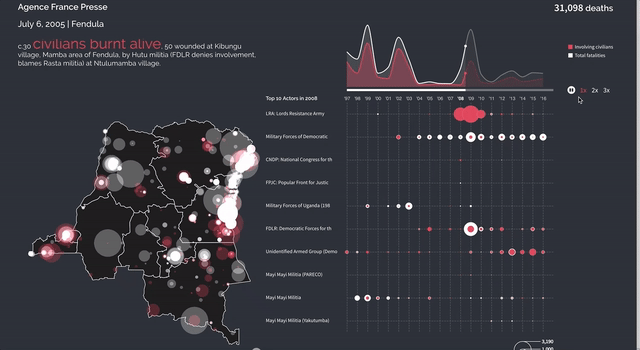
Timeline View
In this view we wanted to convey both the complexity of the situation as well as let users understand the cumulative impact of the devastating conflict in this region. The timeline view shows an interactive map that animates the build up of conflicts over the 20 year period from 1997 to 2016. We present data around the number of fatalities as well as key actors and events surrounding these fatalities. Over time, we see a shift in key actors as old new actors enter the picture with the progress of time. The visualization also includes descriptive text that helps contextualize the situation. At any point a user may pause the animation to interact with the data themselves.
Actor Analysis
In this analysis we wanted to focus on the key actors and their interactions with each other evolved over time. Some key questions include:
- Who are the major plays in the network at any point in time?
- How are the actors distributed across type of actor?
- For any given actor, who are they in conflict with and who are they allied with?
- How do these relationships change year over year?
The first half of this view focuses on the key actors in the region as well as their impact on the DRC and surrounding regions since these actors rarely operated in a vacuum. This view also offers several filters so users can drill down further.

The second half of this visualization explores the interconnectedness betwen actors and explores how alliancs form and break over time.
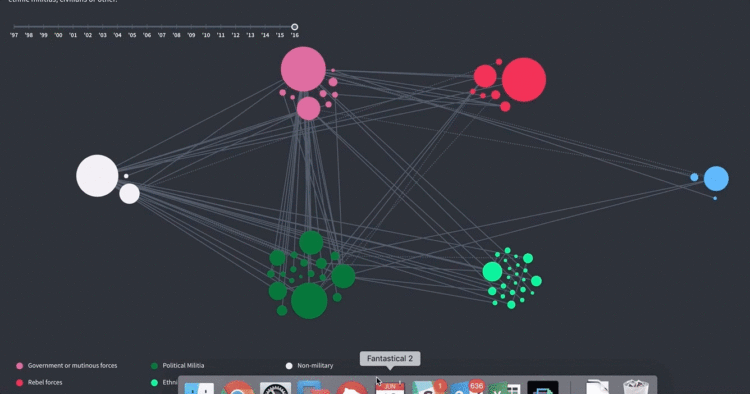
Each node in this network diagram is sized by their relationship to violence — the bigger the circle, the more fatalities associated with events involving that actor.
Outcome Prediction
Our data scientists created 100+ new features that describe each event and used machine learning algorithms with the most relevant features to predict which events are likely to have a fatal outcome.
This view was put together in partnership with our Data Scientists who were exploring the question ‘How likely is a hypothetical event to have a fatal outcome?‘
